See traffic according to RPKI/ROA validation state with pmacct, influxdb and grafana
Written by Arnaud no commentsI will skip the explanations around RPKI/ROA and ROV (Route Origin Validation), I guess you already know the "basics"; if not, you should check this very well written "RPKI documentation" : https://rpki.readthedocs.io/en/latest/index.html
I also suggest to see this presentation "From Zero to RPKI Hero" to get explanations of how things works and how to setup your validator(s) and router's configuration : https://www.youtube.com/watch?v=7OBBz-IcEl4
We will now see the RPKI validators, PMACCT configuration, how to import pmacct data to influxDB and make some fancy graphs with grafana. As you will see below some traffic considered as "Invalid but Valid*" might need some investigations before dropping RPKI/ROA invalid routes as your may lose more traffic than expected if you are a transit provider.
Setup your RPKI validators
So, before configuring pmacct, you will need to install a validator (or fetch a JSON file at https://rpki-validator.ripe.net/api/export.json for example). But it's always better to setup your own validator(s) for several reasons (you will always have up-to-date data, be able to rely on this data, and also be able to add some "Local exceptions" if needed).
Current validators implementations my be split between the validator itself (like OctoRPKI or the RIPE RPKI Validator) and the RTR server (like GoRTR and RIPE RTR server) or tie together (like routinator).
Louis Poinsignon from CloudFlare provided good explanations on https://blog.cloudflare.com/cloudflares-rpki-toolkit/ and Fabien Vincent wrote some interesting blog posts about Routinator and ROV with IOS-XR on https://beufa.net/blog/
I like the RIPE RPKI Validator for his nice web interface (public "demo" at https://rpki-validator.ripe.net/trust-anchors) but all of them have provided a docker image, so you have absolutely no excuse: RIPE RPKI validator (no RTR server), Routinator, OctoRPKI and GoRTR. You can also bind GoRTR to your RIPE RPKI Validator or Third-party JSON.
This has become a running gag but ... "Dont forget to install the ARIN TAL!" By default validators will have TAs installed for AFRINIC, APNIC, LACNIC, RIPE NCC, but not ARIN. You can download the ARIN TAL at https://www.arin.net/resources/manage/rpki/tal/. Check your validator documentation to install it (RIPE doc).
Here is an example how to run GoRTR (feeded with the JSON from CloudFlare) and routinator with "Local Exceptions" (see SLURM, RFC 8416) adding local exceptions on validators will be usefull later in the visualisation.
docker run -d --restart=unless-stopped --name gortr -p 8282:8282 -p 9552:9552 -v /home/rpki:/home/rpki cloudflare/gortr -metrics.addr :9552 -slurm /home/rpki/slurm.json


docker volume create routinator

docker run --rm -v routinator:/home/routinator/.rpki-cache nlnetlabs/routinator init -f --accept-arin-rpa

docker run -d --restart=unless-stopped --name routinator -p 3323:3323 -p 9556:9556 -v routinator:/home/routinator/.rpki-cache -v /home/rpki:/home/rpki nlnetlabs/routinator -x /home/rpki/slurm.json server --rtr 0.0.0.0:3323 --http 0.0.0.0:9556


docker restart gortr

# Wait few minutes

docker logs gortr

# level=info msg="Slurm filtering: 175005 kept, 0 removed, 6 asserted"
Ok then! Now that we have the validators setup, let do the trick in PMACCT.
PMACCT
Make sure you have a fairly recent PMACCT release (v1.7.6-git fixed some errors I had with routinator). I will suppose you already have a working pmacct setup, if not check my blog post : https://afenioux.fr/blog/article/pmacct-sfacct-influxdb-grafana
Paolo Lucente added some instructions in the pmacct/CONFIG-KEYS and pmacct/QUICKSTART (search for RPKI). Here is an extract of my sfacctd.conf regarding RPKI/ROA validation :
! Defines the remote IP address and port of a RPKI RTR cache
! Only one cache server is supported
rpki_rtr_cache: 10.10.10.10:3323
rpki_rtr_cache_version: 1
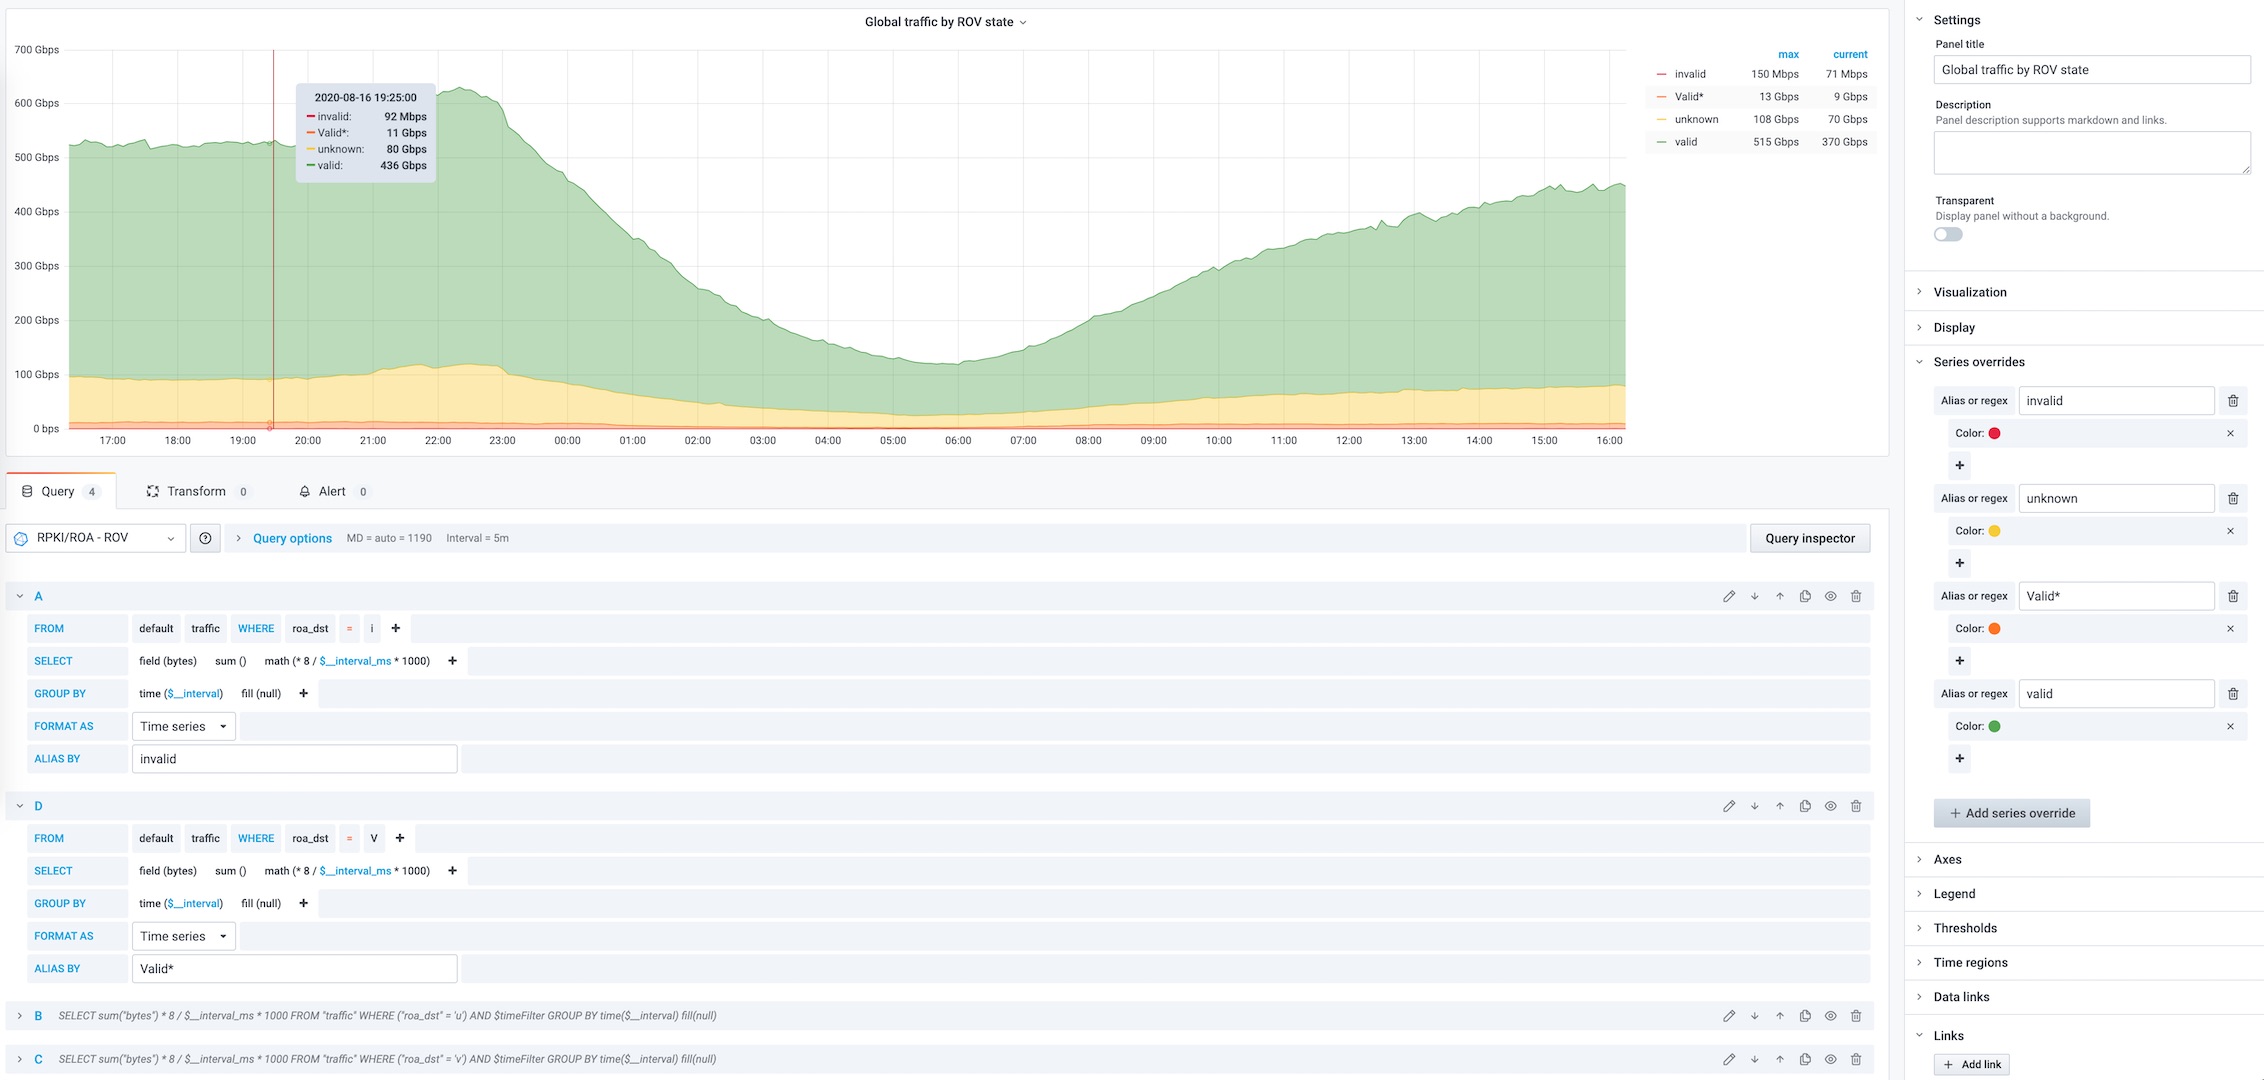
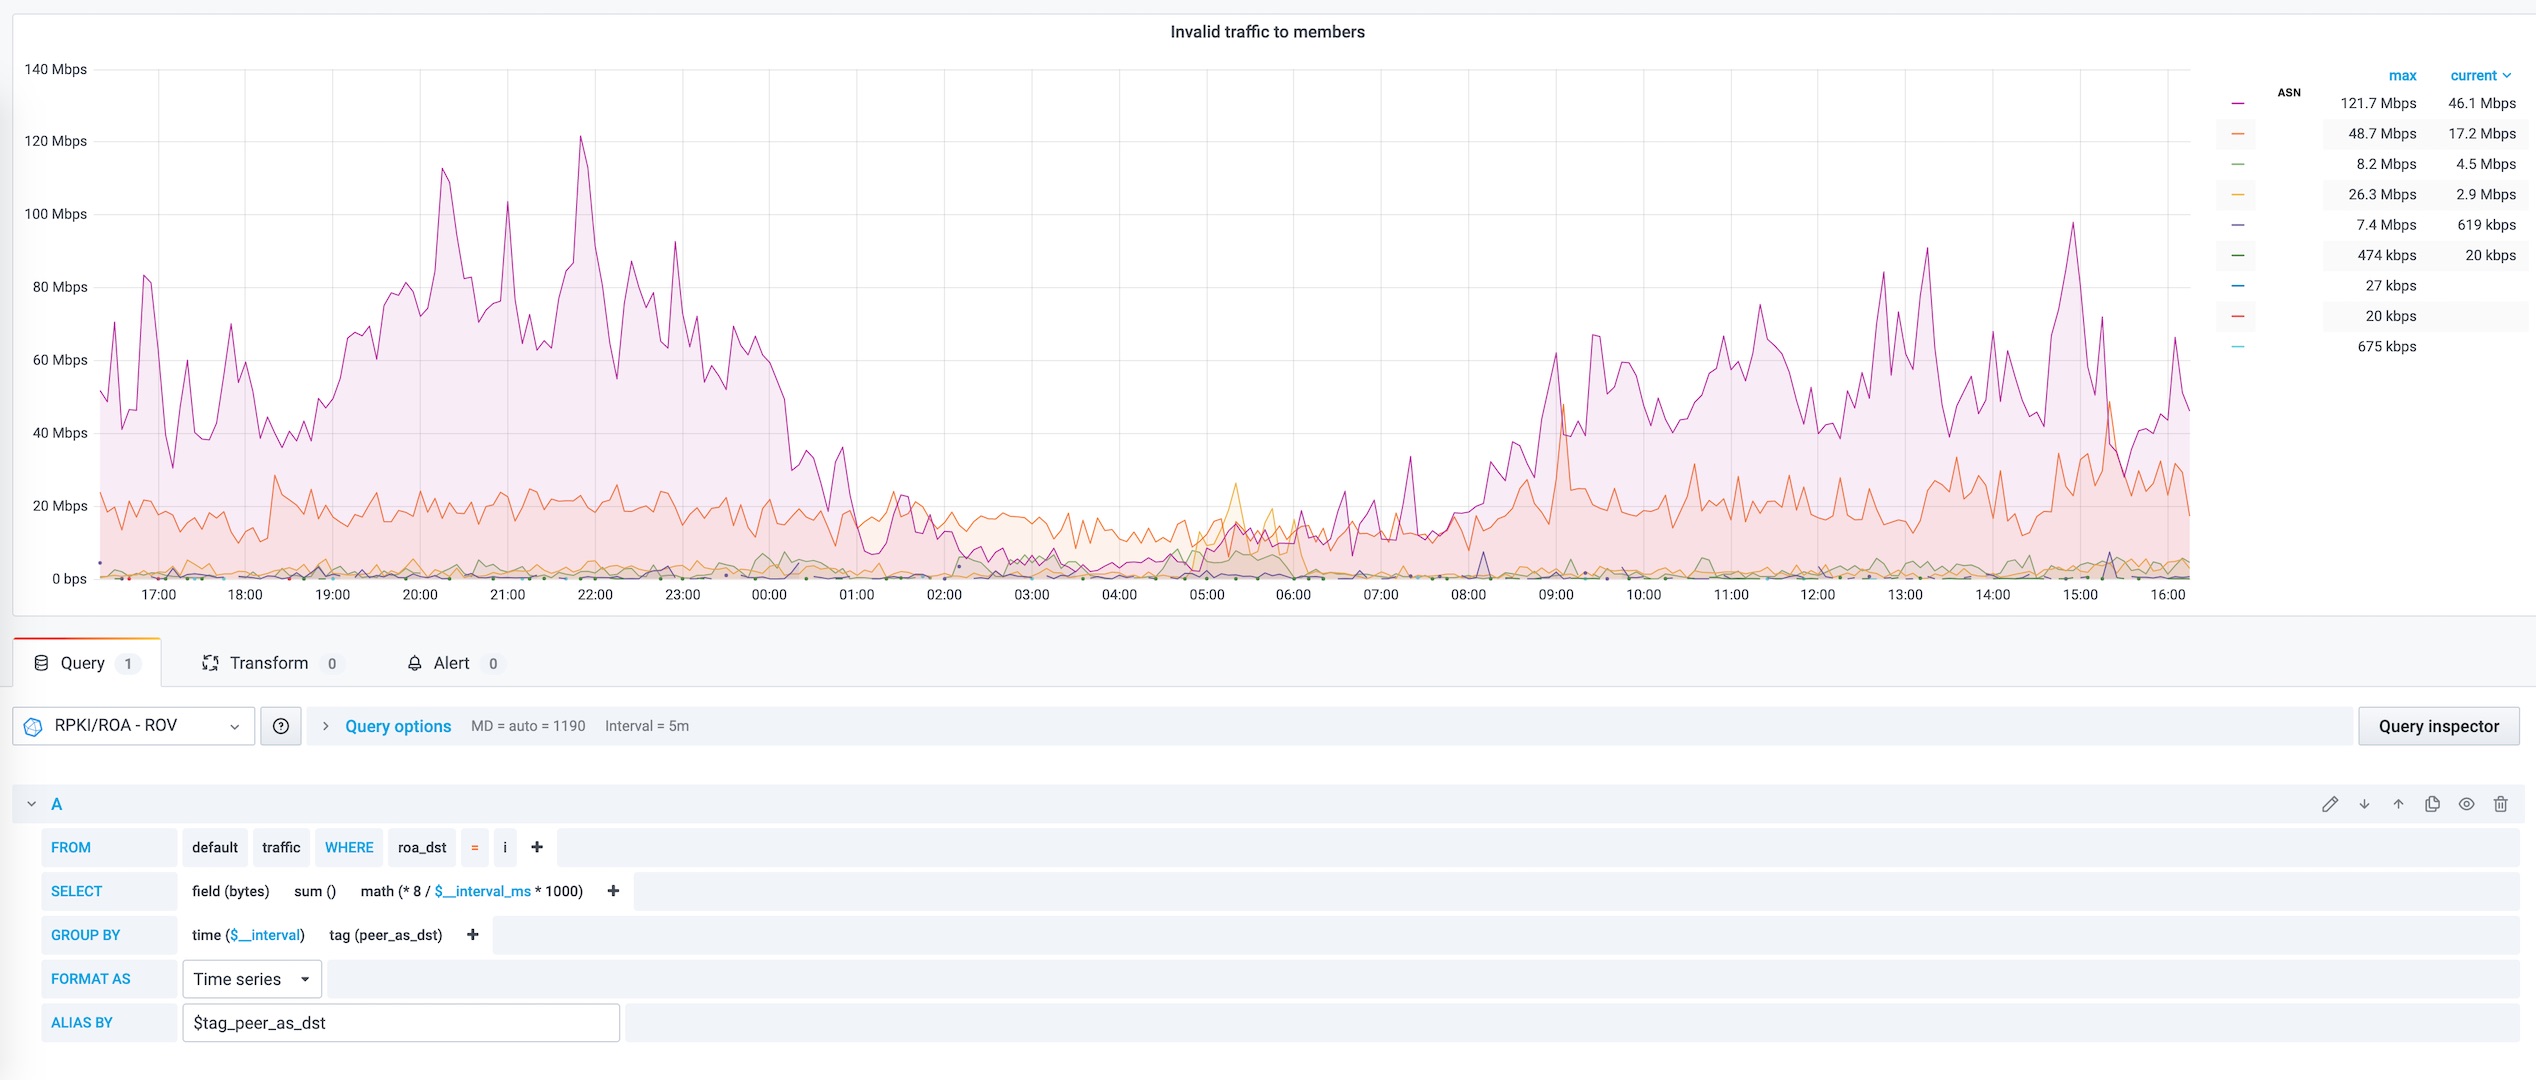
plugins: print[print-rov], memory[mem]! The ROA fields will be populated with one of these five values: 'u' Unknown, 'v' Valid, 'i' Invalid no overlaps, 'V' Invalid with a covering Valid prefix and 'U' Invalid with a covering Unknown prefix.
aggregate[print-rov]: peer_src_as, peer_dst_as, dst_roa
! Used to see networks with state "Invalid but Valid" (V) : pmacct -e -s -T BYTES | grep V
aggregate[mem]: peer_dst_as, dst_as, dst_net, dst_mask, dst_roa
! by default file is overwritten
print_output_file[print-rov]: /tmp/5m_avg-rov.json
print_output[print-rov]: json
print_history[print-rov]: 5m
print_history_roundoff[print-rov]: m
print_refresh_time[print-rov]: 300
! we want to run this script after purging cache :
print_trigger_exec[print-rov]: /opt/pma2influx-rov.shAs you could see, despite the valid, unknown, invalid states there is also a very confusing and interesting state 'V' Invalid with a covering Valid prefix. I found two examples for this 'V' state :
#show bgp rpki roa ipv4 178.196.0.0/15
Prefix Max Length ASN
------------------ ----------- -----------
178.192.0.0/13 24 3303
178.192.0.0/13 32 6837
#sh ip bgp 178.196.0.0/15 longer-prefixes
RPKI Origin Validation codes: V - valid, I - invalid, U - unknown
Network Next Hop Metric AIGP LocPref Weight Path
* > V 178.196.0.0/15 37.77.40.133 11 - 100 0 3303 i
"Well ok" nothing fancy here, RFC6811 states : "Valid: At least one VRP (Validated ROA Payload) Matches the Route Prefix."
Warning from https://rpki.readthedocs.io/en/latest/rpki/securing-bgp.html
According to RFC 7115, operators should be conservative in use of maxLength in ROAs. For example, if a prefix will have only a few sub-prefixes announced, multiple ROAs for the specific announcements should be used as opposed to one ROA with a long maxLength. Liberal usage of maxLength opens up the network to a forged origin attack. ROAs should be as precise as possible, meaning they should match prefixes as announced in BGP.
#show bgp rpki roa ipv4 93.0.0.0/14
Prefix Max Length ASN
------------------ ----------- -----------
93.0.0.0/11 11 15557
#show ip bgp 93.0.0.0/11 longer-prefixes
RPKI Origin Validation codes: V - valid, I - invalid, U - unknown
Network Next Hop Metric AIGP LocPref Weight Path
* > V 93.0.0.0/11 37.77.38.13 0 - 100 0 15557 i
* > I 93.0.0.0/14 37.77.38.13 0 - 100 0 15557 i
Oh this is interesting! This means that when I will switch-on ROV (RPKI/ROA Route Origin Validation) on my routers and drop invalid routes, the more specific network won't be accepted anymore.
This bring us to several possibilities :
1/ I'm a "stub network" (also called "Tier 3 network") and only have Internet connectivity for my network, then nothing to worry about.
2/ I'm a transit provider and have BGP customers, if they are single-homed to me or they already do ROV, then nothing to worry about.
3/ I'm a transit provider and have BGP customers, if they are multi-homed, then they may still see the more specific route through another transit provider and I may loose the traffic going through my network.
In the case presented here, we can see that the more specific route comes from the same next-hop and has same AS-PATH, being known that it may hard to find the good contact in huge company to fix the issue, you may chose to whitelist this route using a "Local Exception" (see SLURM, RFC 8416 and an example with routinator from Fabien or Configure filters and overrides with GoRTR) or eventually add exceptions on your routers.
So we definitely need to make a deep dive on this "'V' Invalid with a covering Valid prefix" traffic before dropping RPKI/ROA invalid routes.
Importing pmacct data to influxDB
I could have chosen to use telegraf (which I know and love for its flexibility), but because I will be working on the same host (and already had written a script), let's make it easy.
If needed, please read my previous blog post to see how to create the Database and a Retention Policy.
#!/usr/bin/env bash

# Written by Arnaud Fenioux


DATABASE='rov'

SRC_FILE='/tmp/5m_avg-rov.json'

DST_FILE='/tmp/pma2influx-rov.txt'


# Header for influx import

echo -e "# DML \n# CONTEXT-DATABASE: $DATABASE" > $DST_FILE


# We will import all the primitives of sfacctd as tags into influx (with the same name)

# only bytes are saved as field value

# these records are stored in a MEASUREMENT name "traffic"

# sfacctd BYTE size is w/o L2 informations, We need to add them to be more accurate with SNMP counters

# (26 bytes w/o VLAN tag, 30 bytes with) * PACKETS count


cat $SRC_FILE | sed 's/{//; s/}//; s/"//g; s/:/=/g; s/\ //g;' | sed -r 's/event_type=purge,//; s/stamp_inserted=\S+,packets/packets/;' | sed 's/,packets=/ /;s/,bytes=/ /'| awk '{print "traffic,"$1,"bytes="$2*26+$3}' >> $DST_FILE


# This is the JSON for one aggregation

# {"event_type": "purge", "roa_dst": "v", "peer_as_src": 64500, "peer_as_dst": 64501, "stamp_inserted": "2020-08-14 14:40:00", "stamp_updated": "2020-08-14 14:45:01", "packets": 294879232, "bytes": 367028363264}


# This is a record to add to influx, no timestamp specified, Influx will add it at this time of import

# traffic,roa_dst=v,peer_as_src=64500,peer_as_dst=64501 bytes=374695223296
# Adding some metrics
ROA=0
let ROA=$ROA+$(curl -s http://validator:9552/metrics | grep 'rpki_roas{filtered="filtered",ip_version="ipv4"' | awk '{print $2'})
let ROA=$ROA+$(curl -s http://validator:9552/metrics | grep 'rpki_roas{filtered="filtered",ip_version="ipv6"' | awk '{print $2'})
echo validator,name=gortr roa=$ROA >> $DST_FILE
ROA=$(curl -s http://validator:9556/status | grep final-vrps: | awk '{print $2}')

echo validator,name=routinator roa=$ROA >> $DST_FILE


# This is how we import data into influx

influx -import -path=$DST_FILE
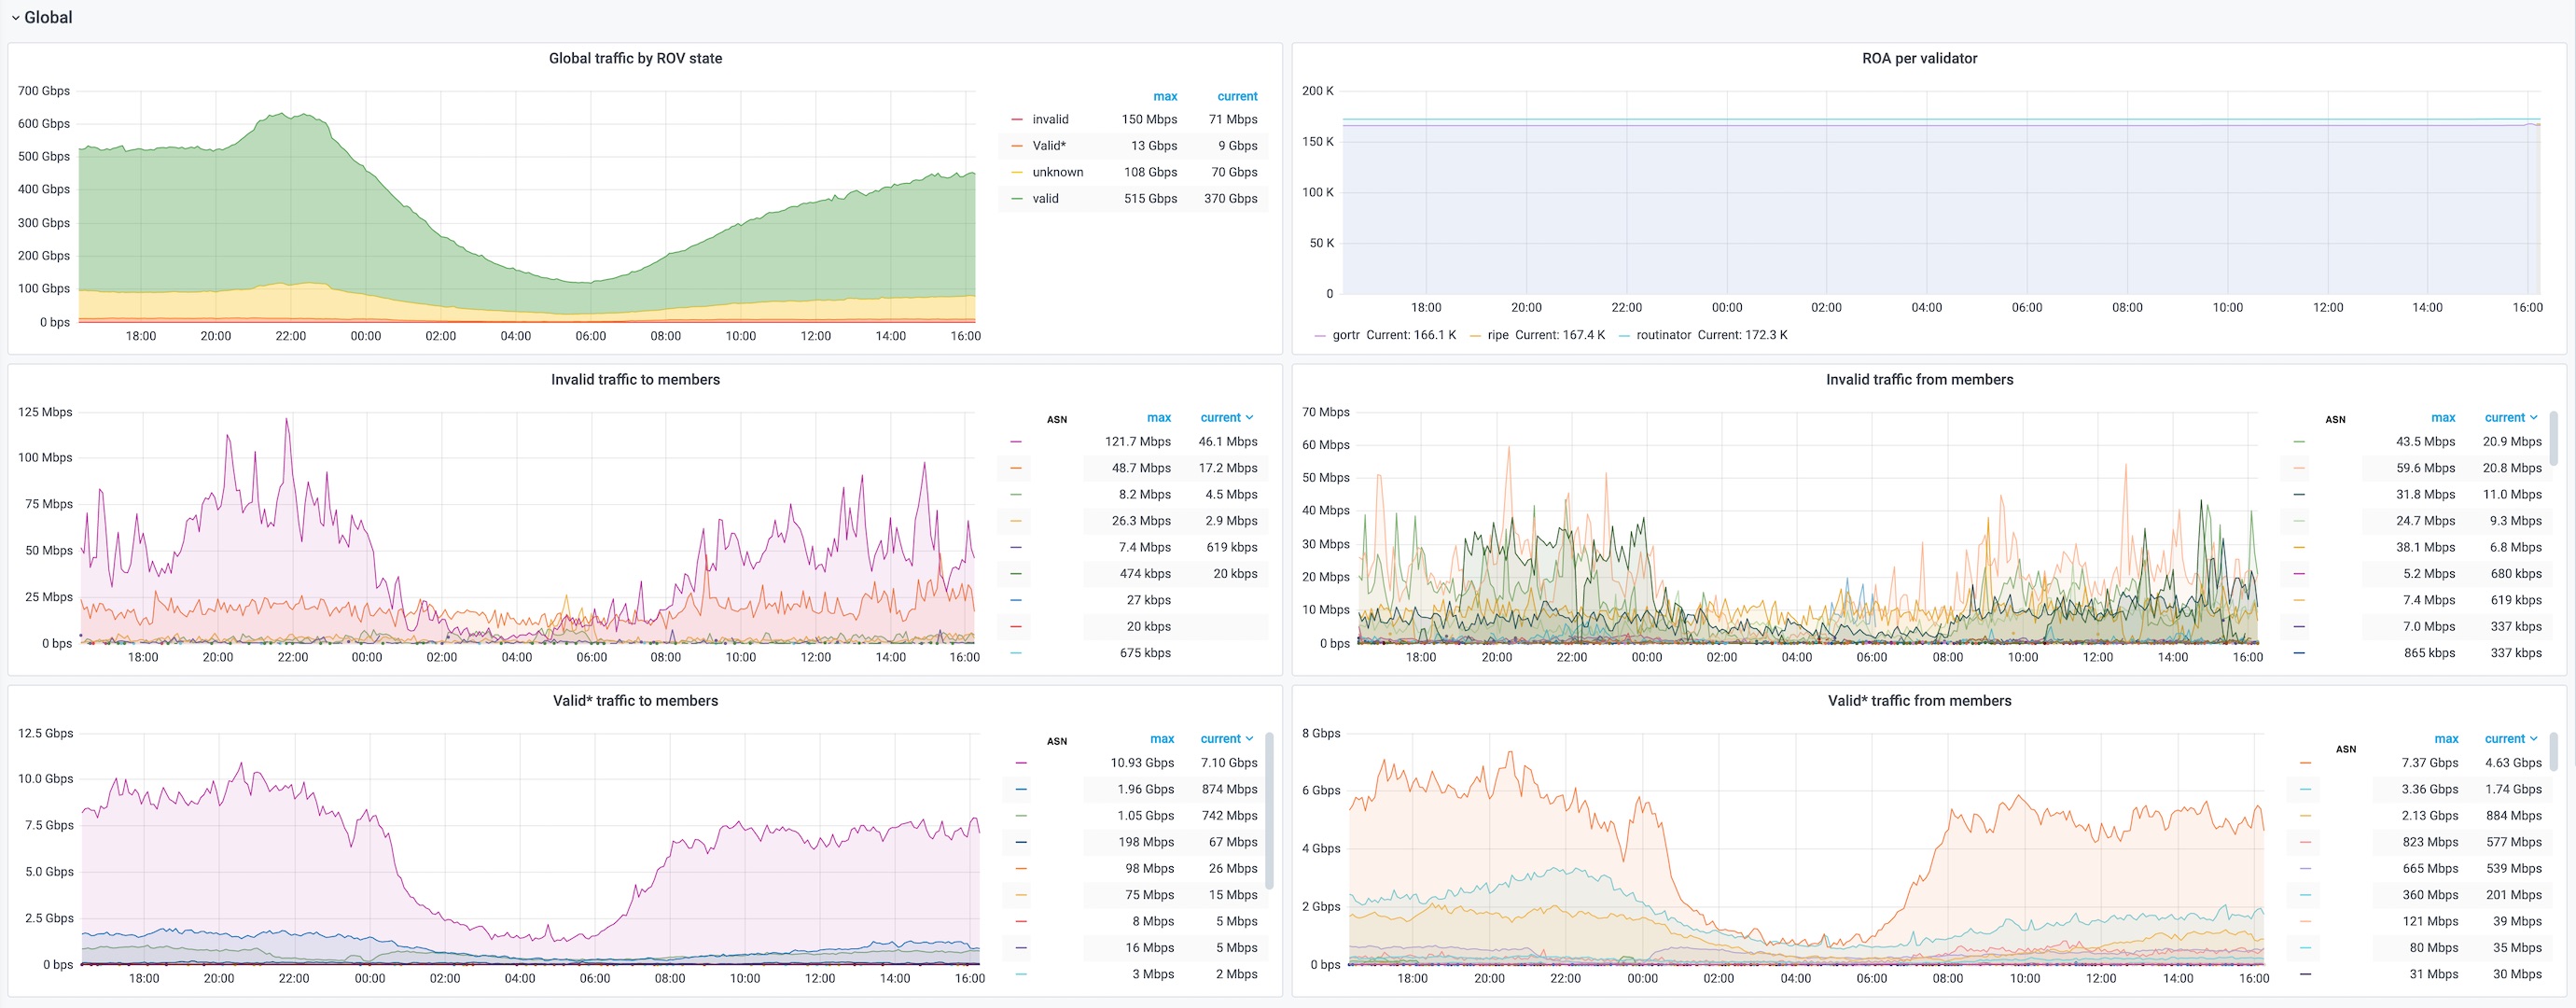
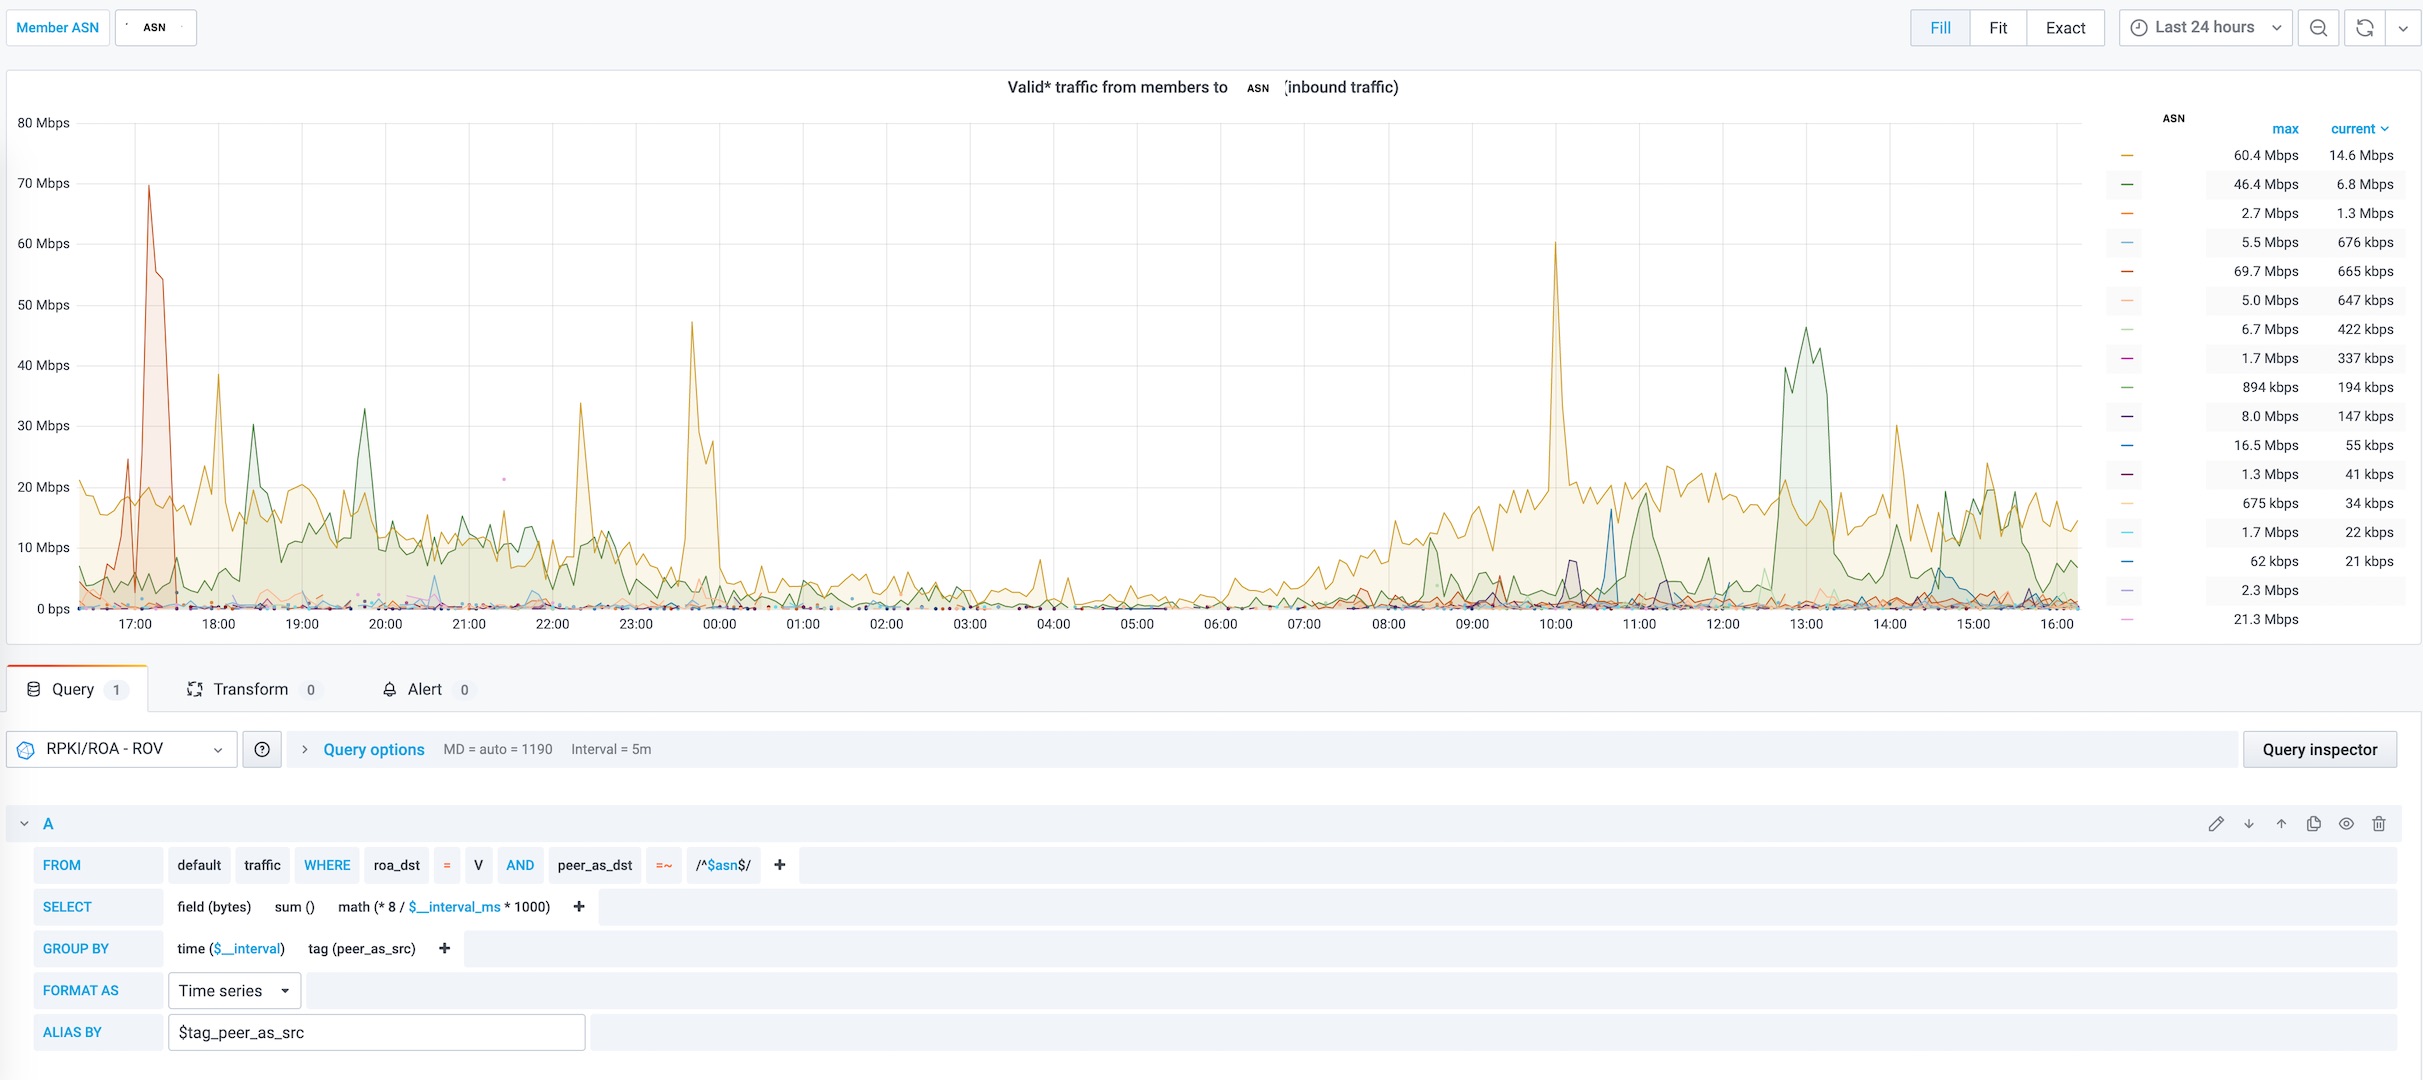
And then Grafana
I guess you have a working grafana setup, go to Configuration - Data source to add your new DB and make your dashboard!
Click on the images for more details, You can download this grafana Dashboard.